Where do users abandon the workflow?
Understand what stops users from reaching value in your Figma plugin
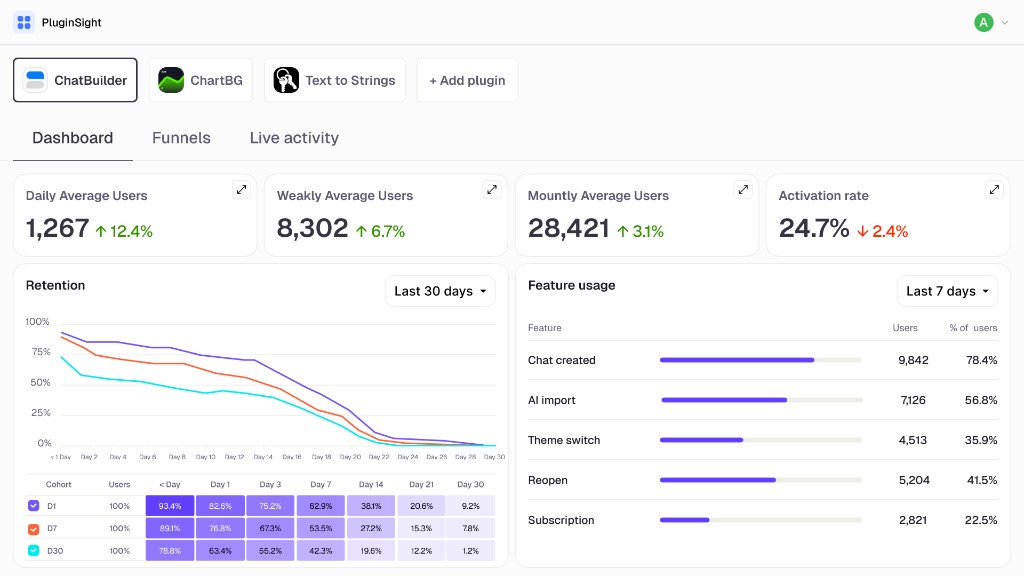
Pluginstat shows the path from opening your plugin to the first successful action: where users drop off, which features they use, and how new versions affect activation, errors, and retention
The problem
Many installs — and you still don't know if your plugin works
Figma can show installs, likes and comments. But those numbers do not explain whether users reached value, where they dropped off, or what changed after a release.
Do users return after the first run?
Which features are actually used?
Did the last release add friction or remove it?
How it works
From event in code to product decision
Pluginstat removes unnecessary setup: you connect the SDK, and product answers appear in the dashboard on day one
1 Connect the SDK
One import and a project key — no manual pipeline building or data schema work
2 Send events
Use built-in plugin events or add your own for key actions
3 View reports
Activation, funnels, retention, versions, and errors organized into clear screens
4 Improve your release
See where users get stuck and ship targeted fixes
Features
Analytics built for the way Figma plugins work
Pluginstat gives Figma plugin creators a focused analytics layer for events, funnels, retention, errors and release impact — without building a custom data pipeline.
Ready-made event schema
Track plugin opened, action started, action completed, error occurred, version upgraded and custom events.
// code.ts — main thread
figma.ui.postMessage({
  type: "analytics-init",
  analyticsId: "usr_…"  // from clientStorage
});

// ui.ts — UI iframe
import "./analytics.js";

onmessage = (event) => {
  if (event.data.pluginMessage?.type === "analytics-init") {
    pluginstat.init(event.data.pluginMessage.analyticsId);
    // → plugin_opened
  }
};

pluginstat.track("action_completed", {
  flow: "export",
  selectedNodes: 18
});

pluginstat.trackException(err, {
  reason: "token_refresh"
});
Conversion funnels
See who reached the outcome, where the path breaks, and which actions drive repeat usage
Version comparison
After each release, see what changed in activation, errors, and user behavior
Release impact
v1.7.2
Activation41 %
Error rate2.8 %
Day-7 retention18 %
v1.8.0
Activation47 %
Error rate1.9 %
Day-7 retention22 %
Live activity
Watch analytics events stream in real time as users open your plugin, complete actions and hit errors.
Real-time events
Event
User
Time
plugin_opened
usr_8k2m9x4p
1 hour ago
action_started
usr_9m1q7w2k
42 min ago
action_completed
usr_9m1q7w2k
38 min ago
error_occurred
usr_2p7n5c8h
12 min ago
Use cases
When data starts saving time
Validate a new release
Within 24 – 72 hours, see whether activation dropped or errors increased after an update
Find the weak spot
Spot the step where users abandon the flow and improve that step first
Prepare for monetization
Measure real engagement before a paid plan, instead of relying on install counts
Compare plugins
Teams with multiple plugins can see which products are growing and which need attention.
Metrics
The metrics your plugin actually needs
Installs
How many users added the plugin.
Active users
How many users actually opened it.
Activation
How many users reached the first valuable action.
Feature adoption
Which features are used most.
Funnel completion
Where users drop off.
Retention
Whether users return after first use.
Error rate
Where plugin experience breaks.
Version impact
How releases affect behavior.
Pricing
Simple pricing for every stage
Every plan includes the full analytics toolkit — choose by plugin count and team needs
Starter
One plugin with everything you need to understand usage
$18 / month
- 14-day free trial
- 1 plugin project
- Events, funnels, retention, and version comparison
- CSV export and custom events
Pro
Same full toolkit for up to three plugins
$29 / month
- Up to 3 plugin projects
- Events, funnels, retention, and version comparison
- CSV export and custom events
Team
Unlimited plugins with shared team access
$59 / month
- Unlimited plugin projects
- Team access and shared dashboards
- Events, funnels, retention, and version comparison
- CSV export and custom events
FAQ
Quick answers
Figma provides basic public signals such as installs, likes and comments. Pluginstat focuses on behavior inside the plugin: events, activation, funnels, retention, errors and version impact.
You add the Pluginstat SDK, initialize a user ID and send events for important actions. Pluginstat turns those events into reports.
Start with installs and active users, then track activation, funnel completion, feature adoption, retention, error rate and version impact after each release.
Yes. You can use the ready-made event schema or send custom events for plugin-specific actions.
Yes. Pluginstat helps you see how a release changes activation, errors, retention and feature usage.
Yes. Pluginstat tracks whether users return after first use and shows retention trends over time.
No. You can use Pluginstat for published plugins and plugins still in development.
Every plan includes the full analytics toolkit. Starter covers one plugin after a 14-day free trial, Pro supports up to three plugins, and Team adds unlimited plugins with shared team access.
Waitlist
Get visibility into how your Figma plugin is used
Join the waitlist and tell us what you want to learn from your plugin users. We are inviting Figma plugin creators who want better insight into activation, retention, feature usage and release health.